A system formed by the interconnection of several electrical components is called a network. “Network” can be used as a synonym for circuit, “network analysis” is circuit analysis, but it is rarely said, which adds a bit of mystery. In the field of RF communication, any circuit unit with more than one port can be called a network, and this network is often regarded as a “black box”. It does not care about what is going on inside the circuit unit, but adds appropriate excitation signals to the ports to test the response of the circuit, so as to characterize the characteristics of this network. “Network analysis”, which is often called in the field of RF communication, is the work of describing the performance of RF circuits bounded by ports.
1. Scattering Parameters
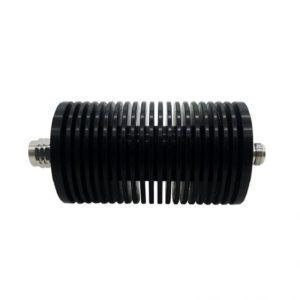
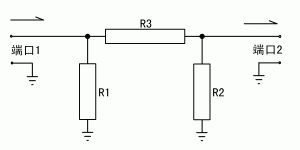
In order to further understand the convenience of network analysis, it is necessary to understand the language of network analysis – scattering parameters. Figure (1) is our Fixed Attenuator (2) is its circuit diagram. How to describe its performance most simply and clearly? People familiar with traditional circuit analysis can easily think of opening the port on the right first, and then testing the resistance on the left with a multimeter; Then open the left circuit and test the resistance on the right. Apply proper current to the left side, then test the voltage on the right side with a voltmeter, and then test it again in reverse. According to these data, four parameters are obtained successively: open circuit input resistance, open circuit output resistance, open circuit forward transmission resistance and open circuit reverse transmission resistance. When you see this pile of deja vu parameters, you will ask: what is the relationship between this thing and attenuator, and what is the favorite attenuation?
This example shows that the Z parameter (open circuit impedance parameter) commonly used in low-frequency circuits is neither customary nor difficult to measure in the field of RF communication. To sum up, there are three important reasons for us to choose a new parameter to describe the circuit: (1) most RF circuits do not allow open or short circuit of the port, because doing so will make the circuit deviate from the predetermined working state; (2) When the wavelength is very short, even if the signal propagates only a short distance, the phase shift can not be ignored, which makes the test and calculation very difficult; (3) A complete set of methods is needed to design the circuit quickly and simply according to the obtained parameters. Based on the above reasons, scattering parameters came into being.
Scattering parameters are often referred to as s parameters. Similar to the impedance parameter, for a network with two ports (such as attenuator), it also includes four parts, represented by SIJ, where I represents the port to be detected and j represents the incident port of the excitation signal:
S11: the reflection amount of a port of the device under testing (DUT) to the signal, also known as return loss;
S21: Change (amplitude and phase change, also known as insertion loss or gain) when the signal passes through the device under test;
S12: change when the signal passes through the device under test in the opposite direction;
S22: Reflection amount of signal from another port of the device under test.
When a port is not used during the test, the matching load shall be connected, so that the circuit can be very close to the normal working state. To measure the scattering parameters, we only need to understand the changes caused by the signal flowing through the tested device, and will not affect the normal operation of the circuit, so it is more simple and direct. The network analyzer to be introduced later is a special device for measuring scattering parameters.
Through mathematical calculation, the scattering parameters can be converted to other types of parameters.
The four s parameters represent the voltage ratio (or power ratio, which should be unified in calculation) of the outgoing signal and the incoming signal. Take the attenuator as an example. In figure (2), the power of the incident signal is 1W, and the output is 0.1W after passing through the device to be tested, then S21 = 0.1 / 1 = 0.1. The conversion component is – 10dB. So the attenuation of this attenuator is 10dB. This relative value is a function of frequency. As the frequency changes, the attenuation of the attenuator may fluctuate. Taking the frequency as the abscissa and the attenuation as the ordinate, the amplitude frequency characteristic diagram can be obtained, which is abbreviated as the amplitude frequency characteristic diagram.
Sometimes we need to pay attention to the change of phase after the signal passes through the circuit. For example, if an antenna inputs a signal of 1W ∠ 0 °, the reflected signal power measured on the port of the antenna is 0.5 times of the incident signal (called the reflection coefficient), but the phase difference of the voltage between the reflected signal and the incident signal is 90 degrees, then the S11 of the antenna is expressed as 0.707 ∠ 90 °, indicating that there is – 3dB return loss and the phase lag is 90 degrees.
2. Benefits of network analysis
It is easy to understand the benefits of network analysis after understanding the scattering parameters. For the attenuator in the above example, when the parameter of attenuation is directly obtained after network analysis, we can intuitively understand what effect the attenuator will produce when it is connected to the RF circuit. The following antenna example further illustrates the convenience of this analysis method.
Through network analysis, the S11 parameters of the antenna can be directly measured, including an amplitude (or power) relationship and a phase relationship, such as 0.5 ∠ 90 °. Figure (3) is a S11 relation diagram of polar coordinates. Its radial coordinates represent the amplitude relationship and the angle of rotation around the axis represents the phase relationship. Figure (4) is an impedance diagram represented by rectangular coordinates. The abscissa represents resistance and the ordinate represents reactance. Make coordinate transformation from rectangular coordinate to polar coordinate for figure (4), and make the scale conform to the unit impedance (Zn = Z / Z0, Z0 = 50 Ω) and reflection coefficient( Γ) The relationship between Zn = (1)+ Γ)/ (1- Γ), The impedance circle diagram shown in Fig. (5) can be obtained. Figure (3) and figure (5) are overlapped to obtain Smith chat (Figure 6). In this figure, the input impedance of the antenna can be read directly according to S11 parameters. Our purpose is to match to transmit the maximum power. At this time, there are two methods: (1) the end of the transmission line provides an output impedance conjugate with the input impedance of the antenna; (2) By debugging and connecting matching elements, the input impedance of the antenna becomes pure 50 Ω. For the latter method, the size of matching elements can be easily solved on Smith diagram.
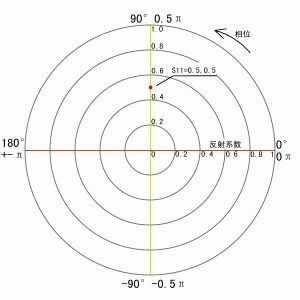
Figure 3
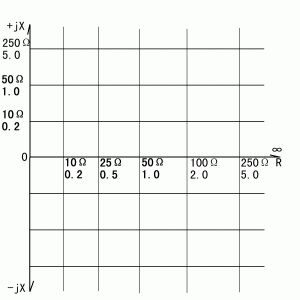
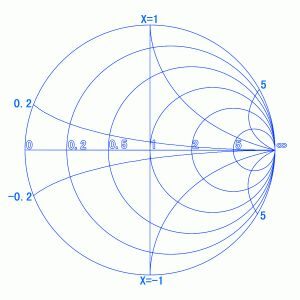
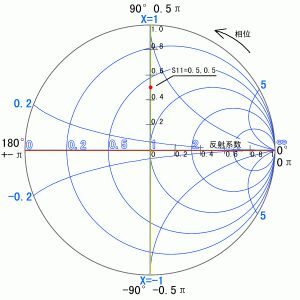
Figure 4 Figure 5 Figure 6
No matter the reflection coefficient phase diagram or Smith diagram, there is no frequency coordinate. The S parameter of a frequency corresponds to only one point on the graph. The process of displaying the results by the network analyzer is to scan several frequencies, then draw the measured s parameters on the diagram and connect them with smooth curves.
In fact, people have invented a set of methods to use s parameters, which can greatly simplify the RF circuit design. There are already a lot of materials in this regard, which interested readers can understand by themselves.
3. Network analyzer
With the above foundation, now we should pay attention to how to obtain the S parameter. A long time ago, although seeking the S parameter has been the most convenient means in network analysis, it is still a very troublesome thing. In principle, it is nothing more than sending a stable signal to the device to be tested with a signal source, and then measuring the output power with a level meter, or testing the voltage with a measuring line at different distances, so as to calculate the amplitude and phase. The problem is that this test can only target one frequency at a time. If you want to understand the change trend of different frequencies, you need to carry out multiple measurements, sometimes for a few days.
With the development of automation technology, computer-controlled network analyzer comes out. This instrument can continuously measure the S parameters of multiple frequencies, and it only takes a few seconds. Especially in the last decade, the price of network analyzers below 3GHz has been greatly reduced, and the so-called “public version” instruments have also appeared in China. Manufacturers everywhere are surging, so that this kind of expensive equipment that can only be installed by large scientific research institutions can be popularized to almost all RF engineers at once, and will be popularized to enthusiasts in the near future.
1)The simplest network analyzer – frequency sweeper
The frequency sweeper is a testing device for S21 parameters. It consists of a signal source with variable frequency and a detector. The device to be tested is connected between the signal source and the detector. When testing, first connect the detector directly to the signal source, let the signal source sweep all the frequencies to be tested, and store the amplitude detected by the detector. After connecting the device to be tested, the detector detects a new amplitude (power) value. Compare the new amplitude value with the amplitude value just stored to obtain the S21 parameter. With the continuous scanning of the signal source controlled by the computer, the amplitude frequency characteristic diagram can be drawn.
Adding a reflective bridge or directional coupler to the frequency sweeper can be used to measure S11 parameters. S11 parameter and voltage standing wave ratio (VSWR) can be directly converted, so the standing wave ratio curve can be displayed.
The frequency sweeper can only get the amplitude frequency characteristic diagram, so it is a scalar network analyzer.
2)Multi input channel frequency sweeper
The above frequency sweeper has only one detection channel. Although the S parameter given by this instrument is a relative value, it measures an absolute value. From the absolute value to the S21 parameter, the test results are compared with the stored results. This method can not avoid a problem: with the different devices to be tested, the output power of the signal source may change. In order to eliminate this error, a two channel frequency sweeper is usually used, one of which is used as the “reference channel”. A splitter is used to directly take out part of the signal from the signal source and send it to the reference channel. The value of the other channel is compared with the reference channel to obtain the S parameter. The scalar network analyzers we usually see are almost all such multi-channel frequency sweepers.
The multi-channel scalar network analyzer can also realize vector analysis with the help of some ingenious methods, such as Karel Hoffman’s technology. With the progress of vector analyzer, this application has been reduced day by day.
3)Spectrometer with tracking source
The detector of the frequency sweeper has broadband characteristics. No matter the test signal, the harmonics of the signal source and various disturbances of external coupling are detected at the same time. If the device under test is a notch filter, it can not effectively compress the harmonic, so the measured notch amount can not be less than the harmonic amount. If the device under test is an installed antenna, the air signal received by the antenna will also enter the detector, which will cause the measured standing wave value to be falsely large. In addition, the dynamic range of the detector is usually up to about 70dB, resulting in a small dynamic range of the instrument.
The spectrometer with tracking source replaces the detector of the frequency sweeper with the receiver of the spectrometer. The spectrum receiver only responds to the signal within the IF bandwidth, and the harmonics of the tracking source and the interference of external coupling will not have a significant impact on the test results. Therefore, notch devices can be tested. The spectrometer has low detection noise and good if amplifier. This network analyzer composed of tracking source and spectrometer can usually reach a dynamic range of more than 100dB.
If there is no tracking source, the maximum holding function of the spectrometer can be used to form a simple network analysis system with the manually scanned signal source.
Some high-end scalar network analyzers also adopt similar schemes. Since the signal source frequency and its harmonics of the network analyzer can be predicted, the “spectrum receiver” of this instrument does not need a good out of band suppression index, and a receiver much simpler than the usual spectrum analyzer can be used.
4)Vector Network Analyzer,VNA
Except for some special occasions, the network analyzer mentioned above can only obtain the amplitude frequency characteristic diagram and the standing wave curve derived from it, so it is a scalar instrument. In order to obtain the impedance parameters of the device under test, the phases of the input and output signals must be compared. Therefore, vector network analyzer (VNA), referred to as vector network, is needed. All network analyzers are composed of signal source and some kind of detector specially used to detect the signal sent by the signal source. The main hardware difference between vector network and standard network lies in the detector. In order to carry out vector detection in sufficient dynamic range, generally speaking, it is necessary to mix the signal first, accurately gate the signal generated by the signal source with if filter, and then compare the phase on if.
Historically, phase detection is mostly based on the principle of trigger. Firstly, the two IF signals requiring phase comparison are shaped, and then sent to two flip flops. When a trigger is triggered by the rising edge of the signal crossing zero, the counter starts counting clock pulses. Stop pulse counting when another trigger is triggered. In this way, the time difference between the rising edges of the two intermediate frequencies is obtained. Since the IF frequency is known, the phase difference can be obtained through simple conversion. Assuming that the IF frequency is 100kHz, in order to obtain a phase resolution of 0.1 degrees, the clock frequency needs to be higher than 360mhz without additional means.
The current commonly used phase detection methods are based on the principle of synchronous detection, and gradually rely on digital signal processing technology. Like other methods, part of the output signal and input signal of the part to be tested (called reference input, represented by R port on the instrument) are first synchronously down converted to a relatively low IF frequency. If no reference channel is set, the signal source needs to be phase locked with the variable frequency local oscillator. After intermediate frequency filtering and amplitude conditioning, ADC is used for synchronous sampling, and the obtained digital signal enters large-scale FPGA for digital conversion to generate two groups of I / Q signals. After digital filtering, one group of signals is conjugated and multiplied with the other group of signals, and then the phase difference is calculated by appropriate vector rotation algorithm. Other mathematical operations can also be used to obtain the phase difference. These processes are basically completed by software and have high flexibility. The careful design of the digital processing process can achieve the phase discrimination accuracy within 0.1 degree with relatively high efficiency.
It is not enough to get only the phase difference and amplitude difference – the measured values are not the real situation on the part to be tested. Whether it is mixing, filtering, signal conditioning, or cables, sockets and bridges, it will affect the amplitude and phase. These effects must be eliminated from the measured original data to get the correct results. For the elimination of S11 measurement error, the open circuit short circuit load three-step calibration is usually used. This calibration requires opening the instrument port first, storing a set of data in the open circuit state, and then storing the data in the case of short circuit and matching load. These data are used as the known quantity of the error model to determine the error of any other test and return the results to the original.
Using an appropriate calibration model can not only eliminate the electrical length error of various connecting wires inside and outside the instrument and the phase shift of filters and amplifiers, but also greatly reduce the requirements for some indicators of hardware. It happens that these indicators have been difficult to improve. The directionality of electric bridge is an example.
Here is an idealized example. The actual situation is much more complicated. It is known that the directivity of the standing wave bridge is 0dB, that is, there is no directivity. How to measure an antenna whose return loss is less than 30dB, that is, the standing wave is less than 1.1? Readers who know the astrolabe may think it’s a bit of a myth, but calibration can solve this problem – provided there is a buffer between the extraction point of the forward signal and the bridge. Imagine that if the instrument is connected with a matching load, the amplitude and phase relationship of the measured forward signal and “reverse signal” at this time will be stored. Then connect the antenna, let the instrument measure again, calculate the “reverse signal” of the background according to the phase amplitude relationship just stored, and subtract it from the result to obtain the actual reverse signal. At this time, you are probably thinking, if the isolation of S21 test is not good, can you do the same?
Just now we did a subtraction to make directionality out of nothing. It looks fun, but the cost is very high. The instrument must have sufficient phase and amplitude resolution before the software can calculate a little directivity. If two sinusoidal signals are exactly the same, their subtraction is exactly equal to zero. If there is a little difference, it will leave a lot of things after subtraction. For vector network, 0.1dB amplitude resolution and 0.1 ° phase resolution are the minimum indicators. It is difficult to maintain stability at such a resolution. Once the drift or change the test conditions, the calibration model will become invalid immediately, so it should be calibrated frequently.
4.Common uses of network analysis
Through the above description, readers may have thought far more than the author about what network analysis can do. Finally, I’ll sort it out for you as the end of the article.
The simplest network analyzer – frequency sweeper, with a small number of accessories (such as standing wave bridge), can meet the needs of most verification purposes and a small number of debugging purposes in communication engineering, and the scalar data of S11 and S21 are obtained. Inspection of RF devices, cables, etc. If supported by software, it can also be used as signal generator and field strength table, although it is not accurate. At the same time, the frequency sweeper can debug the band-pass filter and find the resonance point of the coil and resonance network. For the band stop filter and notch filter, if a large notch ratio is not required, it can also be preliminarily debugged. When debugging notch filters with large notch ratio (such as duplexers), the observation range can be increased by connecting low-pass or band-pass filters in series. Of course, the frequency sweeper is a simple scalar instrument, which can not directly read the impedance, so it can not intuitively find out the matching parameters. Based on the characteristics of broadband detection, it is not advocated to use it to debug amplifiers and other active circuits.
The antenna analyzer is a single port network analyzer. Although many things are called antenna analyzers, their properties are very different. If the bridge is built into the frequency sweeper, it will become the simplest antenna analyzer, which can test the standing wave curve of the antenna. Whether it is a frequency sweeper or such a simple talent, it may make the test results unreal when used in situations with strong external interference.
Between the frequency sweeper and the vector antenna analyzer, there is also a “half vector talent”, which has the ability to test phase or impedance in some form, but does not provide calibration function. Use it to measure an antenna with 100 Ω pure resistance. If a cable equivalent to one eighth of the wavelength is connected, it will be measured as 40-j30 Ω. This kind of test must be corrected manually, otherwise it will be confusing. Reasonable use of this talent can debug the input impedance of antenna and amplifier, and measure the resonance point of antenna and coil. If the software supports it, it can also be used as a signal source.
Vector talent is a standard network analyzer, which can measure the complex S11 parameters and a series of data derived from it. Due to the perfect calibration function, the return loss range that can be tested is usually better than 50dB, and the measured impedance is also credible. The inverse Fourier transform of the test data of a frequency band can obtain several time-domain parameters, such as the return loss of the cable at different distances. Vector talent has also been applied to a certain extent in fields other than communication, such as testing the water content of crops.
The spectrometer with tracking source and the scalar network with tracking receiver have similar uses as the frequency sweeper, but they both have much better dynamic range and better selectivity. They can be used for antenna measurement under strong interference conditions and notch filter debugging with large notch ratio, such as duplexer debugging.
The full-featured dual port or multi port vector network covers all the above purposes and has powerful analysis function. It should be mentioned that the full-function vector network is generally equipped with group delay display and power scanning functions as standard. The latter can analyze the nonlinear characteristics of the device.
There are many kinds of network analyzers, far more than the above. They all have a signal source and several amplitude or phase amplitude detection channels. Combined with the necessary signal distribution device, the built-in or external directional bridge and coupler form a complete instrument. The purpose of network distribution is not fixed. After understanding its measurement principle, many ingenious usages can be extended. It is not too much to compare it to a universal meter in the field of RF. Network analysis and network analyzer are the most basic tools for designing, debugging and improving RF circuits. At the same time, they should also be the most commonly used means and tools. After mastering the network analysis technology, the design and manufacture of RF communication circuit will be more interesting.